← Blog · 📝 Article · 28 July 2026
Draw bias explained for lay bettors: spot losers faster

Draw bias is a measurable, track- and distance-specific tendency in flat racing where a horse’s starting stall confers a structural advantage or disadvantage before a single stride is taken. For lay bettors, that matters immediately: a horse with reasonable form sitting in a prime draw at a bias-heavy course can look like a value back but is actually a lay risk, while a well-fancied runner stuck in a disadvantaged stall is worth upgrading to a lay candidate. Tools like The Race Lab, RaceiQ, and FormDial have quantified these effects across UK flat cards. Donkeyradar’s signals incorporate draw bias as one input in a wider statistical model, with a verified strike rate of over 85%.
- Draw bias applies only to flat racing with starting stalls; National Hunt racing has no stalls and therefore no draw bias.
- Treat draw bias as a modifier, not a standalone reason to lay.
- Prime draw plus average form in a bias-heavy race is a lay signal worth investigating.
Table of Contents
- Why does draw bias exist on flat courses?
- When does draw bias actually matter?
- How to use draw bias for lay betting
- How do you measure draw bias reliably?
- Common mistakes when using draw bias
- Quick rules for UK lay bettors
- Key takeaways
- Donkeyradar’s view on draw bias and lay selection
- Donkeyradar gives you pre-filtered lay signals, not raw data to interpret
- Useful sources and data tools
Why does draw bias exist on flat courses?
Track geometry and ground conditions create the bias. On a perfectly level, symmetrical track, stall position would be neutral. No such track exists in British racing.
Courses wear unevenly. The inside rail cuts up under traffic, watering patterns create moisture gradients, and cambers affect how horses balance around bends. Certain strips of ground consistently produce faster times, and horses drawn to start on those strips hold a structural edge.
Two distinct mechanisms drive the effect:
-
Turning courses: low draws save ground around bends. Chester, a tight left-handed oval, is the most extreme UK example. Low draws (stalls 1–4) win at a notably higher rate in sprint races because the inside path is simply shorter.
-
Straight courses: the bias comes from a strip of faster ground, not distance saved. Goodwood’s straight course shows a strong high-draw advantage in large-field sprints because the favoured ground sits on the far rail.
-
Geometric vs surface bias: geometry-driven biases (tight ovals like Chester) are more persistent than surface-driven ones. They survive rain more reliably because the physical path advantage does not disappear when the ground softens.
-
All-weather tracks: synthetic surfaces produce more stable draw patterns because the going does not shift with weather, reducing the day-to-day swings seen on turf.
When does draw bias actually matter?
Bias matters when three conditions align: a proven course-and-distance tendency, a sufficient field size, and going that supports rather than reverses the usual pattern. Miss any one of those and the signal weakens considerably.
Distance is the clearest filter. Bias is most potent in short, turning sprints of 5f–6f, where the distance saved or lost around a bend is proportionally large. Over one mile and beyond, the effect fades markedly because pace and positioning become the dominant variables.
Field size amplifies or removes the effect. Larger fields show the bias most clearly; a 14-runner cavalry charge at Chester is where draw dominates. A six-runner field at the same course rarely shows the same magnitude.
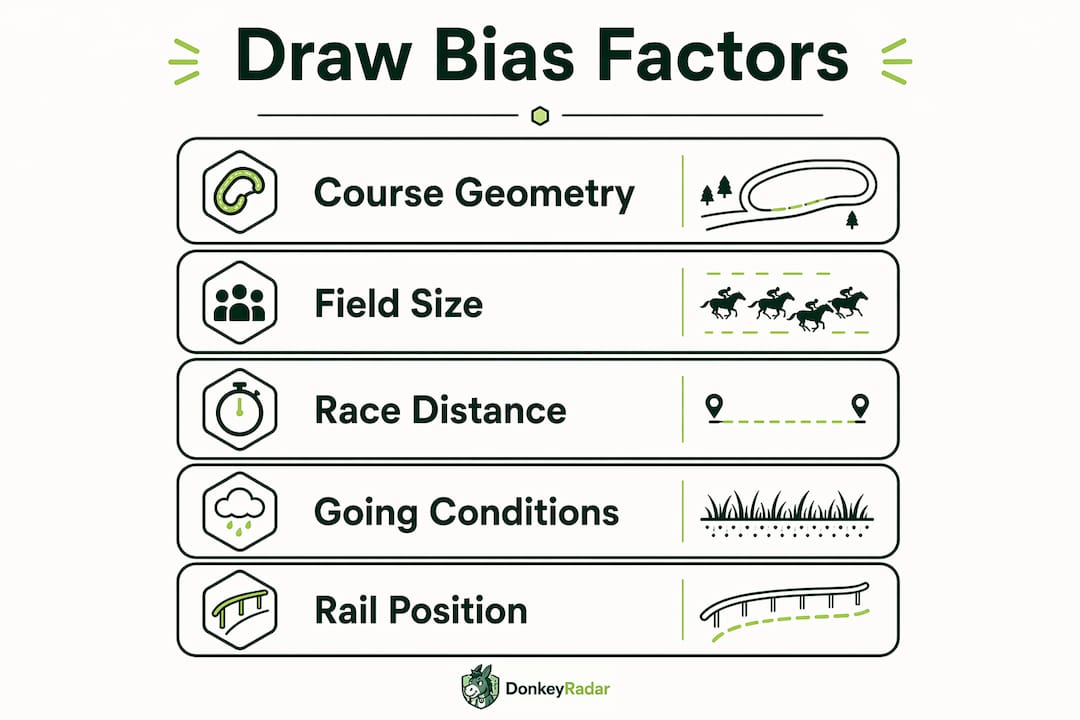
Going and rail position can flip a bias entirely. On soft ground, the inside rail at many courses becomes heavily cut up by earlier races. A low-draw advantage on good ground can disappear or invert by the time the card reaches race five. Goodwood and Ascot move with the going week to week.
Pace shape is the variable most bettors overlook. A horse with a prime draw but a hold-up style may not benefit from a low draw at Chester if it plans to come from the back. Conversely, a front-runner drawn wide at Beverley may still lead if the pace is slow enough to allow it to cross.
Pre-race checklist:
- ✅ Sprint distance (5f–6f) or tight circuit race
- ✅ Field of 10 or more runners
- ✅ Going consistent with the historical bias direction
- ✅ Rail position unchanged from the norm
- ✅ Pace shape reinforces the draw advantage
Pro Tip: Check the first two or three races on the card before committing to a draw-based lay. If early winners are coming from the opposite side to the historical bias, the day’s going or rail has shifted the pattern.
How to use draw bias for lay betting
The practical rule is straightforward: when a horse’s draw works against it in a bias-significant race, its implied probability is overstated by the market. That gap is where lay value lives.
Lay eligibility checklist:
- Confirm a documented bias exists for this course, distance, and approximate going.
- Check the target horse’s stall is in the disadvantaged band.
- Verify the market has not already fully priced the draw disadvantage into a long price.
- Confirm field size is large enough for the bias to operate.
- Check pace forecast — does the horse’s running style compound the draw disadvantage?
How draw interacts with form:
- Prime draw + average form = potential lay candidate (the market may be backing the form without discounting the draw).
- Good form + bad draw = upgrade to lay consideration, especially in sprints with large fields.
- Good form + good draw = avoid laying; the bias reinforces the selection.
Short worked example: A handicap sprint over 5f at Chester with a field around a dozen runners, and a horse drawn wide in stall 11 with solid recent form. Historical data shows stalls 8–12 at Chester 5f produce a materially lower strike rate than stalls 1–5. The market has priced Horse A on form alone. The draw disadvantage shifts implied probability downward. That misalignment is a lay signal. For execution steps on Betfair, the step-by-step lay guide covers staking and liability management in full.
Donkeyradar’s signals flag exactly these situations: pre-filtered candidates where draw, pace, and market pricing combine to identify likely losers, with verified results published before each race.
How do you measure draw bias reliably?
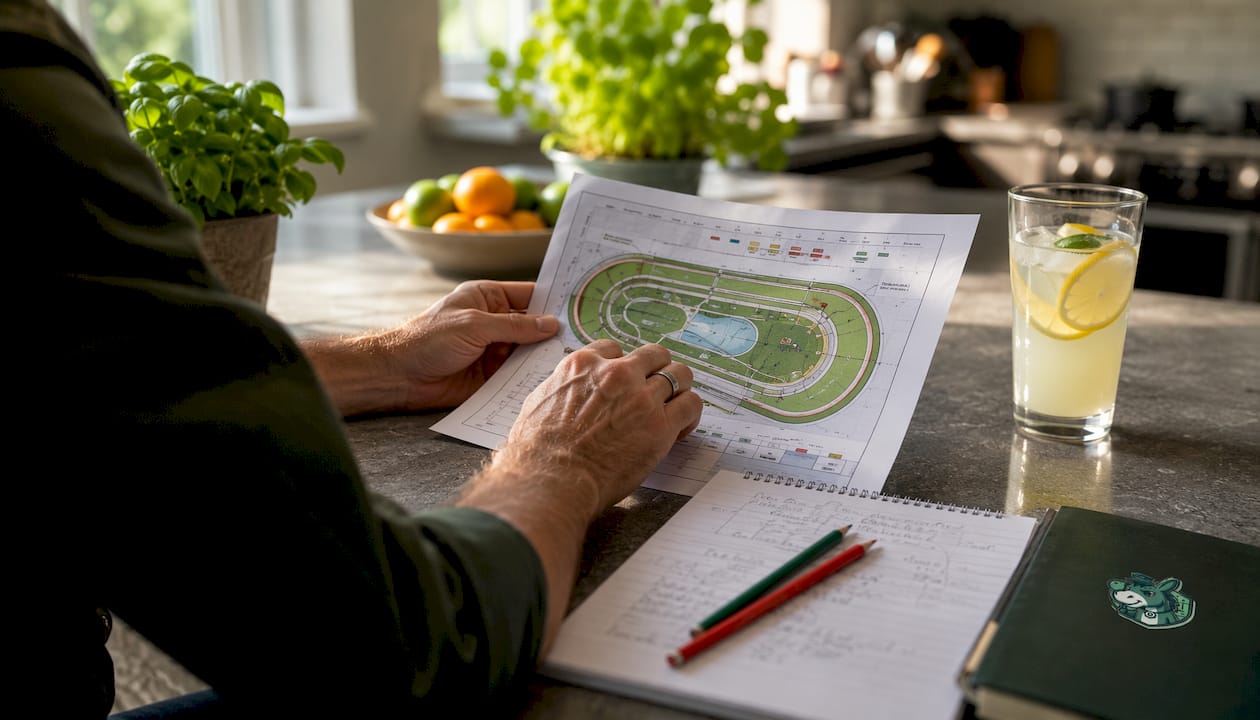
Filter draw statistics by distance and going, and use a sensible recent sample window. Raw all-time aggregates mislead because course configurations change.
Core metrics to track:
- Starts per stall band (low/mid/high thirds)
- Strike rate by stall band
- Net return (ROI) by stall band
- Average beaten lengths by stall band
- Lengths-equivalent adjustment for going and field size
RaceiQ-style models express the best and worst stalls as length equivalents, then adjust for going and field size. That conversion is what lets you translate a stall effect into an implied probability adjustment for lay sizing.
Sample-size guidance: prefer 100 or more starts for a persistent bias claim. Smaller samples need cautious weighting; a 20-start sample showing a 40% strike rate for low draws may be noise.
| Stall band | Metric to check | Minimum sample | Red flag |
|---|---|---|---|
| Low (draws 1–4) | Strike rate + ROI | 100 starts | ROI below –15% despite high SR |
| Mid | A/E value | 100 starts | A/E below 1.0 |
| High | Avg beaten lengths | 100 starts | Consistently 3+ lengths behind |
Quick calculation: if RaceiQ data shows the high-draw band at Chester 5f is worth roughly 2 lengths disadvantage, and 2 lengths at that trip equates to approximately 3–4 lengths of time, you can shade the implied probability of a high-drawn horse down by a meaningful margin and adjust your lay stake accordingly.
Common mistakes when using draw bias
Over-reliance costs money. The most frequent error is treating draw bias as a guarantee rather than a probability adjustment.
- Small-sample noise: a bias showing in 15 races is not reliable; wait for 100+ starts before acting with confidence.
- Ignoring jockey and trainer tactics: a top jockey on a wide-drawn horse at Beverley may cross to the favoured rail early, negating the draw disadvantage entirely.
- Using long-term aggregates without going filters: a bias that holds on good ground may not hold on soft. Always filter.
- Assuming the market has not priced it: well-known biases at Chester and Beverley are widely understood. The market often already discounts the disadvantaged draws, leaving little lay value unless the day’s conditions change the expected pattern.
- Ignoring earlier races on the card: the running rail may have moved, or the going may have changed since the morning declaration.
The real edge lies where the day’s going or rail position changes the expected bias and the market fails to update. FormDial’s guidance makes the same point: the value is in the gap between what the bias actually is today and what the market assumes it to be.
Pro Tip: On all-weather cards, draw patterns are more stable than on turf. If you are new to draw analysis, all-weather sprints are a cleaner starting point because going-driven reversals are rare.
Quick rules for UK lay bettors
Apply these in order when scanning a flat card:
- Fold the draw signal if the race is over 1 mile, the field has fewer than 10 runners, or the going contradicts the historical bias direction.
- Upgrade to a lay candidate when the target horse is in the disadvantaged stall band, the field is 10 or more runners, the distance is 5f–7f, and the pace forecast compounds the disadvantage.
- Ignore the draw when the horse’s running style, jockey tactics, or trainer record at the course consistently overcomes the stall position.
- Check the market price before acting. If the disadvantaged horse is already trading at a long price, the market may have done the work for you and the lay value is gone.
- Cross-reference with early-race results on the day to confirm the bias is operating as expected.
Chester 5f with a 12-runner field and a horse in stall 10: rules 1 and 2 both fire. The distance is right, the field is large, and the stall is in the disadvantaged band. That is a lay candidate worth examining further.
Key takeaways
Draw bias is a structural, measurable tendency in flat racing that lay bettors should treat as a probability modifier, not a betting system in its own right.
| Point | Details |
|---|---|
| Definition and scope | Draw bias applies only to flat racing with stalls; it does not exist in National Hunt racing. |
| When it matters most | Bias is strongest in 5f–6f sprints with 10+ runners and going that matches the historical pattern. |
| Measurement discipline | Filter draw stats by distance and going; require 100+ starts before trusting a bias claim. |
| Common trap | Famous biases at Chester and Beverley are often market-priced; the edge is in day-specific going or rail changes the market misses. |
| Donkeyradar signals | Donkeyradar pre-filters lay candidates using draw, pace, and market data, with a published strike rate of over 85%. |
Donkeyradar’s view on draw bias and lay selection
Donkeyradar uses draw-bias filters as one input in a wider statistical model designed to surface likely losers, not as a standalone trigger. The platform ingests historical stall performance data, filters by distance and going, integrates market-implied probability, and layers in pace modelling before generating a graded lay signal.
The transparency matters. Every signal is published before the race, and results are tracked and verified publicly. That is the standard we hold ourselves to. A data-driven lay strategy built on draw, pace, and market efficiency is more durable than one built on draw alone, and the results history reflects that.
Draw bias is a real, quantifiable edge in flat racing. Used correctly, as one variable among several, it improves the accuracy of lay selection. Used in isolation, it produces false positives. The Donkeyradar model is built around that distinction.
Donkeyradar gives you pre-filtered lay signals, not raw data to interpret
Raw draw statistics require filtering, going checks, pace overlays, and market comparisons before they become usable. Donkeyradar does that work before the signal reaches you.
Each signal already accounts for draw bias, going, pace shape, and market-implied probability. The dashboard shows staking tier grades, links directly to the Betfair Exchange market, and sends real-time alerts via email and Telegram so you never miss a pre-race window. Results are tracked and published openly. If you want to see the lay tips for today or review the full verified results history, both are available on the platform. Sign up free and access daily lay signals immediately, with premium features available when you want deeper analysis and API access for trading software.
Useful sources and data tools
- The Race Lab: how draw bias affects flat racing — course-specific bias analysis and practitioner guidance
- RaceiQ via Racing TV: draw advantages quantified — lengths-equivalent modelling and field-size interaction data
- FormDial: draw bias explained — practical selection rules for backing and laying
- Geegeez: draw bias in horse racing — going-dependent bias reversals and all-weather patterns
- FlatStats draw bias reports — interactive tool for turf and all-weather draw stats filtered by course, distance, field size, and going
- DrawBias.com — course-by-course bias summaries and preferred running styles for UK flat tracks
- Donkeyradar lay betting guides — verified results, daily signals, and strategy guides for UK, Australian, and US flat racing