← Blog · 📝 Article · 31 July 2026
Horse racing data analysis for lay bettors

Three signals reliably surface lay candidates before the off: pace vulnerability via the FAST method, market-implied probability after stripping bookmaker takeout, and context metrics such as longest travellers or first run after a wind operation. Check all three, then size your stake with fractional Kelly and a hard liability cap.
TL;DR:
- An overbet front-runner in a pace-pressured field is the single most repeatable lay setup.
- Strip the margin from live odds, compare to your model probability, and lay only when the market is materially wrong.
- Context flags (equipment changes, long travel, post-wind-op) often explain why a headline win rate is misleading.
Immediate next steps:
- Pull the live odds for your target race, strip the bookmaker margin, and note which runner’s implied probability sits well above your model estimate.
- Map the FAST styles for the field. If two or more front-runners are present, the favourite front-runner is your first lay candidate.
Table of Contents
- What does horse racing data analysis look like in five minutes?
- The three signals that actually predict lay vulnerability
- A reproducible workflow: from form to lay shortlist
- How to size lay stakes safely
- Common mistakes that kill a lay signal
- How Donkeyradar verifies its lay signals
- Key takeaways
- The operational reality most guides skip
- Donkeyradar puts this workflow into practice for you
What does horse racing data analysis look like in five minutes?
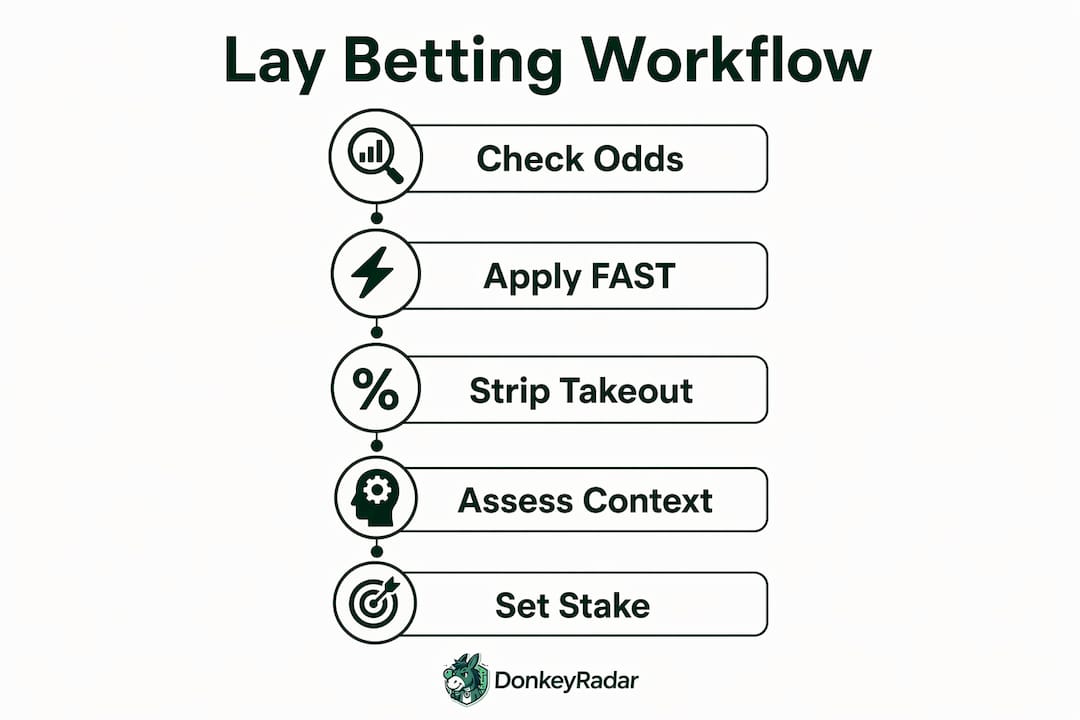
Run these checks in order. The goal is a shortlist of two to four lay candidates before the off.
- Strip takeout from live odds. Convert each runner’s decimal odds to raw probability (1 ÷ odds), sum them, then divide each raw probability by the sum. That is your market-implied probability. Any runner where this figure materially exceeds your model estimate is a candidate lay.
- Map FAST styles. Classify each runner as Front-runner (F), Alternator (A), Stalker (S), or Trailer (T). Flag races with multiple front-runners — pace pressure inflates fade risk for the overbet leader.
- Check context flags. Scan for longest travellers, first run after a wind op, or first-time headgear. These context metrics are updated daily and often explain form anomalies that headline win rates miss.
- Glance at jockey and trainer stats. A jockey with a poor strike rate at the track, or a trainer whose runners consistently underperform at the distance, adds weight to a lay signal.
- Estimate liability. Before placing, calculate your maximum liability: stake × (lay odds − 1). Cap it at a fixed percentage of your session bankroll.
Pro Tip: Watch for late odds drift toward a runner you are already considering laying. A shortening favourite that then drifts back out in the final ten minutes before the off is a live-market signal that sharp money has moved away.
Checks 1–3 work on a phone with a basic odds screen and a notepad. Steps 4–5 benefit from a desktop with a spreadsheet open.
The three signals that actually predict lay vulnerability
FAST pace analysis
The FAST method classifies runners as Front-runner, Alternator, Stalker, or Trailer using normalised early, mid-race, and finish running positions adjusted for field size and distance. A third-placed early position in a 12-horse field signals more forward intent than the same position in a five-horse field — normalisation matters.

When two or more front-runners share a field, pace pressure builds. The overbet leader is forced to burn energy early, and fade risk rises sharply. That is the lay setup: a short-priced front-runner in a fast-paced race where the market has not priced in the energy cost.
Market-implied probability after stripping takeout
Stripping the bookmaker margin from live odds reveals the true market-implied probability. Compare that figure to a model-derived probability to isolate overbet runners.
Short example. A five-runner race. Raw probabilities: 0.45, 0.25, 0.15, 0.10, 0.10. Sum = 1.05. Strip: divide each by 1.05. Runner A’s stripped probability = 0.45 ÷ 1.05 = 42.9%. If your model says 30%, Runner A is overbet by roughly 13 percentage points — a lay candidate. Models trained only on race features often sit near the takeout in terms of ROI; blending model output with market-implied probability is standard practice for finding positive-EV lays.
Context metrics
Context-heavy metrics such as longest travellers, first run after a wind operation, and first-time blinkers or tongue-straps affect performance in ways simple win rates miss. A horse travelling from Scotland to a southern track on a Tuesday, running for the first time post-surgery, may carry a headline win rate of 22% that looks respectable — until you factor in those conditions. These flags do not guarantee underperformance, but they raise the probability that the market is pricing the horse on stale form.
A reproducible workflow: from form to lay shortlist
This process works in a spreadsheet. Minimum columns: Runner, FAST Style, Early Position (normalised), Live Decimal Odds, Raw Probability, Stripped Probability, Model Probability, Overbet Gap, Context Flags.
- Gather past performance data. Pull running positions (early, mid, finish) for the last four to six runs. Note field sizes to normalise positions.
- Assign FAST styles. Label each runner F, A, S, or T based on normalised early position patterns.
- Fetch live odds. Use timestamped snapshots — operational platforms such as TurfOps aggregate form, live odds, and exchange histories for exactly this step.
- Compute stripped probability. Sum raw probabilities, divide each by the sum.
- Score your model. Assign a basic model probability using weighted form factors (speed figures, class, going preference, trainer/jockey strike rate at track and distance).
- Calculate overbet gap. Stripped probability minus model probability. Positive gap = overbet = lay candidate.
- Apply context flags. Add a binary flag column for longest traveller, wind op, new headgear. Any runner with two or more flags moves up the shortlist.
- Handle missing data. If pace data is absent for a runner, default to Alternator and reduce confidence in the signal. Late withdrawals require recalculating stripped probabilities for the remaining field.
Example row:
| Runner | FAST | Stripped Prob | Model Prob | Overbet Gap | Context Flags | Lay? |
|---|---|---|---|---|---|---|
| Horse A | F | 43% | 30% | +13% | Wind op | ✓ |
| Horse B | S | 22% | 25% | −3% | None | ✗ |
| Horse C | F | 18% | 14% | +4% | Long travel | Consider |
A gap above roughly 8–10 percentage points, combined with at least one context flag, is a practical threshold for shortlisting. Below that, the signal is too marginal to justify the liability.
How to size lay stakes safely
Kelly’s criterion tells you the theoretically optimal fraction of your bankroll to stake given your edge. For lay betting, the fractional Kelly variant — typically one-quarter to one-half of full Kelly — is the standard because it reduces variance without sacrificing much long-run growth. Fractional Kelly with hard exposure caps is the approach recommended by practitioners; improper sizing causes large drawdowns even on high strike-rate signals.
Worked example. Bankroll: £500. Lay odds: 4.0. Model win probability for the horse: 30% (so lay probability = 70%). Full Kelly fraction ≈ (0.70 − 0.30 ÷ 3.0) = 0.60. That is far too aggressive. At one-quarter Kelly: 0.15 of bankroll = £75 stake. Liability = £75 × (4.0 − 1) = £225.
That £225 liability is 45% of the bankroll — still high. Apply a hard cap: never let liability exceed 10–15% of bankroll per race. In this case, cap liability at £75 (15% of £500), which means a stake of £25. It feels small. It is correct.
Hard rules:
- Maximum liability per race: 15% of session bankroll.
- Maximum total liability open at any one time: 40% of bankroll.
- Round stakes down to exchange minimums; never round up to chase a cleaner number.
- A single high-odds lay can wipe a session. Cap exposure even when the signal looks strong.
For step-by-step execution on Betfair, the lay a horse on Betfair guide covers the mechanics in full.
Common mistakes that kill a lay signal
- Relying on headline win percentages. A jockey’s 22% win rate means nothing without knowing strike rate at the track, distance, and going.
- Ignoring live-odds drift. A runner drifting out in the final minutes before the off often reflects market intelligence you do not have. Abort or reduce the stake.
- Failing to reconcile gear changes with your model. First-time blinkers can improve or worsen performance; if your model was trained without flagging this, the signal is unreliable.
- Small-sample trainers and jockeys. A trainer with six runners at a track is not a meaningful data point. Treat those signals as noise.
- Pace signals breaking down on paceless turf routes. When no genuine front-runner is present, FAST-based fade predictions lose their basis. Skip the lay or reduce confidence sharply.
Red flags to abort a lay:
- Late rain shifting the going by two or more categories after your analysis was completed.
- A market-moving gamble on your lay target in the final 20 minutes (the price shortens, not drifts).
- Trainer reports a tactical change (hold-up ride instead of front-running).
- The favourite drifts significantly but your lay target shortens — the market is telling you something.
How Donkeyradar verifies its lay signals
Pre-race publication is the baseline standard. A signal published after the result is worthless as evidence of edge. Donkeyradar publishes lay signals before races commence, with results continuously tracked and publicly accessible.
Donkeyradar’s publicly verified results show a reported strike rate of over 85%, with all signals and outcomes documented. The daily lay tips page shows live pre-race signals as they are published, giving you a real-time view of the methodology in action.
Key takeaways
The most reliable lay candidates combine an overbet market-implied probability, pace vulnerability via FAST, and at least one context flag — sized with fractional Kelly and a hard liability cap.
| Point | Details |
|---|---|
| Three priority signals | FAST pace vulnerability, stripped market-implied probability, and context metrics (travel, wind op, headgear). |
| Overbet threshold | An overbet gap above roughly 8–10 percentage points, with a context flag, is a practical lay shortlist threshold. |
| Fractional Kelly staking | Use one-quarter to one-half Kelly; cap liability per race at 15% of session bankroll. |
| Abort red flags | Drift reversal, late going change, or tactical switch from the trainer should cancel the lay. |
| Donkeyradar signals | Donkeyradar publishes pre-race lay signals with a high reported strike rate, tracked publicly. |
The operational reality most guides skip
Race-day conditions compress everything. You have minutes, not hours, and the data you need is rarely all in one place. Pace figures may be missing for a debutant. Live odds move faster than a spreadsheet refreshes. A trainer comment surfaces on social media two minutes before the off.
The process described here is designed for that pressure. Three checks, a threshold, a liability cap. The signal does not need to be perfect — it needs to be consistent and honestly evaluated. A lay at 4.0 that loses is not a failed signal if the process was sound. It happens. Transparency is the whole point.
Donkeyradar puts this workflow into practice for you
If running the full data workflow before every race sounds like a second job, that is exactly the problem Donkeyradar solves. Rather than building your own pace maps and probability models from scratch, you get pre-race lay signals already processed through statistical analysis, published before the off, and graded by staking tier so you know how much confidence the model carries.
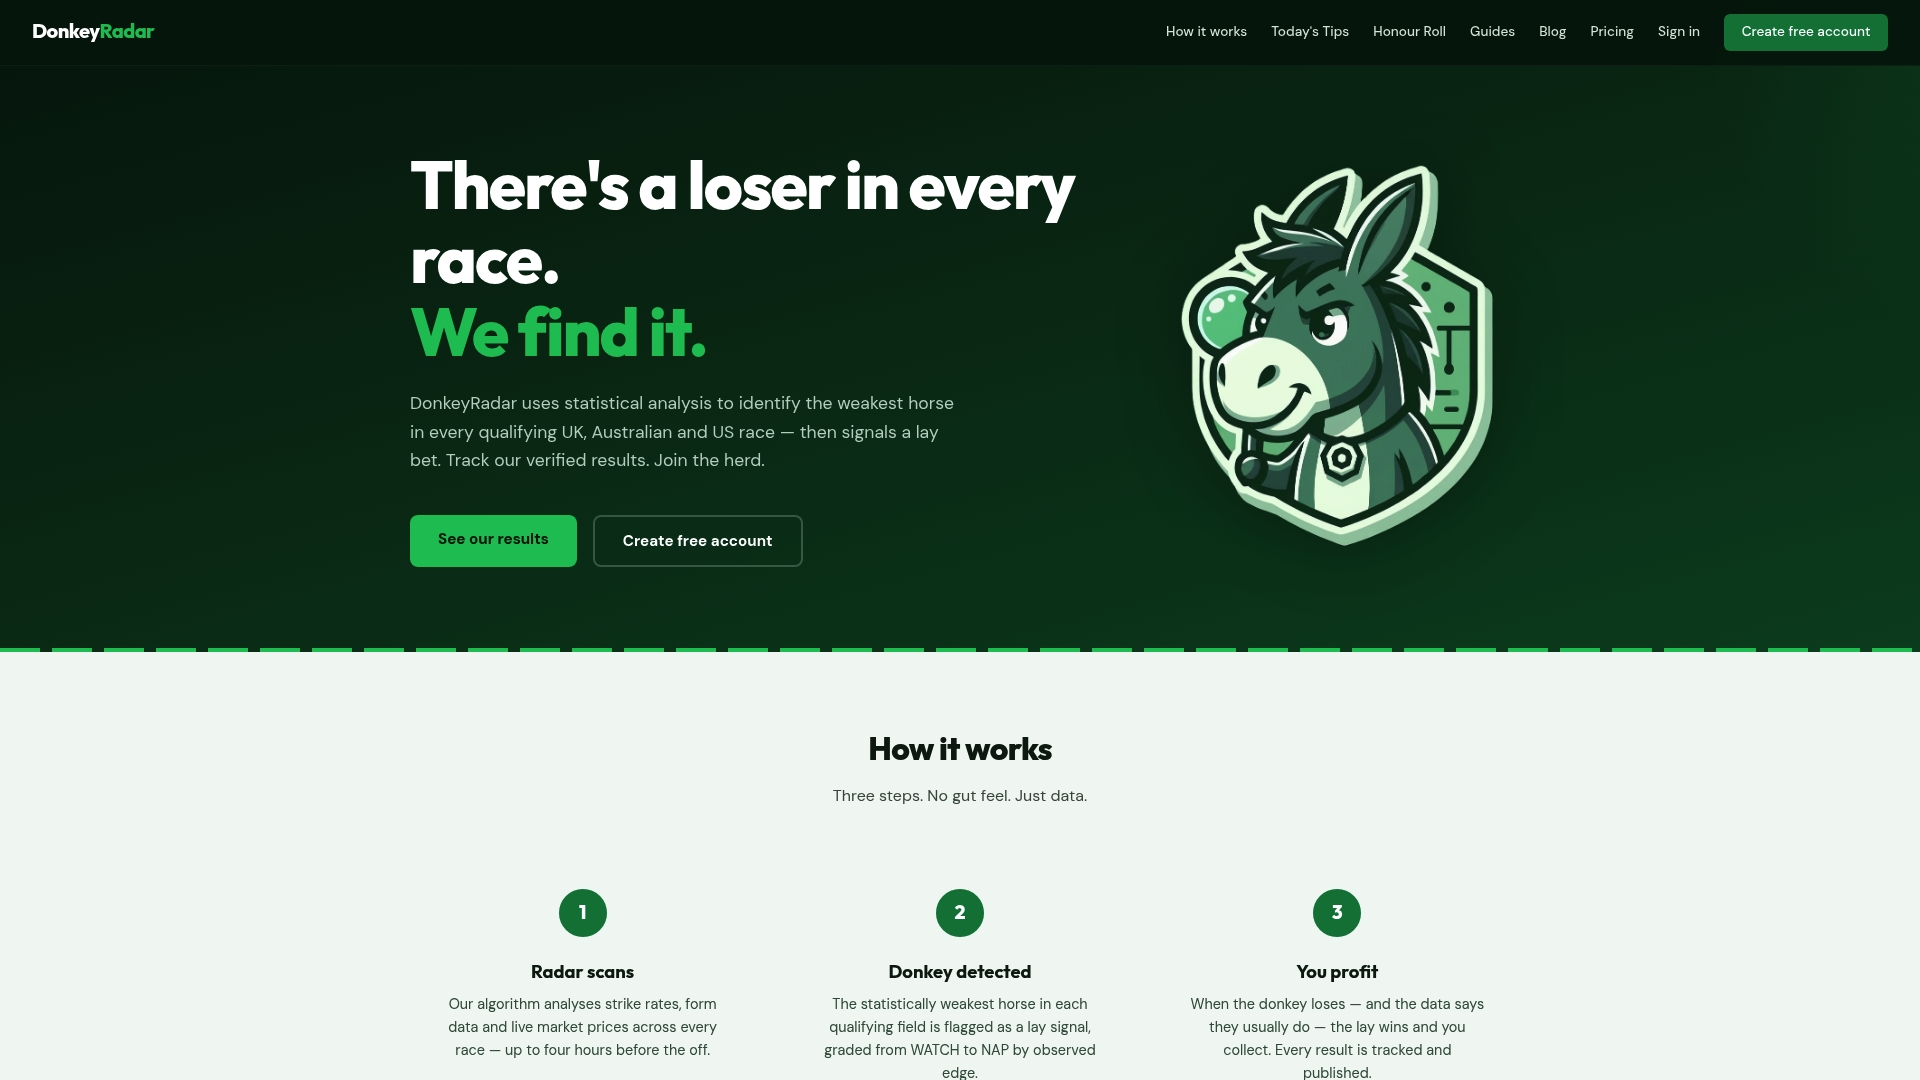
Key features: a dashboard with direct Betfair Exchange links, real-time alerts via email and Telegram, a public results history you can audit, and API access for trading software integration. The verified results and strike-rate reporting are public — not a marketing claim, but a documented record. For bettors who want the data-driven edge without the manual build, the Betfair lay betting strategy guide explains how Donkeyradar’s methodology maps to the workflow above. Profits from betting in the UK are tax-free, which makes a consistent edge worth considerably more than the raw P&L suggests. Start with the free tier and see the signals for yourself.