← Blog · 📝 Article · 24 July 2026
Horse racing data models: a lay bettor's guide

Horse racing data models: a lay bettor’s guide
Horse racing data models are statistical systems that estimate the probability of each horse losing a race, helping you spot lay bets where the bookmaker’s implied odds understate a horse’s true chance of defeat. The core logic is straightforward: when your model assigns a horse a 70% probability of losing but the market prices it as though it has only a 50% chance of losing, that gap is your edge. These models draw on features including horse form, jockey and trainer statistics, track conditions, weight carried, and market-implied odds to generate probabilistic forecasts rather than simple win or loss predictions.
Getting started does not require a data science degree. The foundational approach uses logistic regression, an interpretable method that produces probability outputs directly. From there, you can layer in more complex techniques. Platforms like Donkeyradar demonstrate what a well-calibrated, data-driven approach looks like in practice, combining historical strike rates with live market prices to deliver verified lay signals with an over 85% strike rate.
Key features that drive predictive power in horse racing models:
- Odds-implied probability: the market’s aggregated view, typically the strongest single predictor
- Recent form: average finishing position across the last three to five races
- Jockey and trainer stats: win rates and form over recent meetings
- Track conditions and surface type: turf versus all-weather, going descriptions
- Weight carried: relative to the field average, not in isolation
- Barrier draw: position bias varies significantly by course and distance
- Field size: affects each runner’s base probability and lay liability
Table of Contents
- What are the real limits of horse racing data models?
- How to apply data models to lay betting in UK horse racing
- Getting started with horse racing data models as a lay bettor
- Key takeaways
What are the real limits of horse racing data models?
Prediction accuracy in sports betting models is capped at roughly 70%, and that ceiling exists for a structural reason. Bookmaker odds already aggregate the views of thousands of bettors, so most publicly available information is priced in before you even open a model. Trying to beat that consensus on raw accuracy alone is a losing strategy.
The more productive question is not “how accurate is my model?” but “how well-calibrated are its probabilities?” Calibration matters more than accuracy for profitable betting decisions. A model that says a horse has a 65% chance of losing should be right roughly 65% of the time, not 80% or 50%. When probabilities are well-calibrated, you can reliably identify bets where the market’s implied probability diverges from your model’s estimate.
Starting with logistic regression gives you a clean baseline. If logistic regression cannot find an edge, more complex models are unlikely to either. Once you have that baseline, gradient boosting methods such as XGBoost and LightGBM can capture nonlinear interactions between features that a linear model misses. Neural networks go further still, but they require substantially more data and careful regularisation to avoid overfitting.
Feature engineering is where most of the practical work happens. Useful transformations include normalising weight carried relative to the field average, encoding venue and surface type as binary flags, and calculating experience via the logarithm of career starts rather than raw start counts. Categorical variables like course name and going description need encoding before any model can use them.
Pro Tip: Always validate your model using walk-forward backtesting that respects race date chronology. Training on future data and predicting the past inflates apparent performance dramatically. Split your dataset by date, train on the past, and test on what follows.
How to apply data models to lay betting in UK horse racing
The practical goal is not to predict winners. It is to find horses where your model’s estimated losing probability is meaningfully higher than what the market implies. Every model eventually loses the bookmaker’s margin, so the only sustainable path is identifying genuine divergences between model probability and market odds.
| Horse | Model P(lose) | Market implied P(lose) | Edge | Signal |
|---|---|---|---|---|
| Horse A | high | noticeably higher than market | positive edge | Lay |
| Horse B | moderate | about equal or lower than market | no edge | No bet |
| Horse C | high | noticeably higher than market | positive edge | Lay |
| Horse D | moderately high | slightly higher than market | marginal edge | Marginal |

The table above illustrates the logic. Horse A and Horse C show the model assigning a materially higher losing probability than the market prices in. Those are your lay candidates. Horse B shows the opposite: the market is already more pessimistic than your model, so there is no edge to capture.
Donkeyradar applies this framework at scale, processing historical strike rates alongside live market prices to publish data-driven lay signals before each race. All signals are published pre-race and results are tracked continuously, so you can audit the record rather than take performance claims on trust.
One UK-specific advantage worth noting: betting profits in the UK are tax-free. That applies to Betfair Exchange winnings as much as to traditional bookmaker returns, which directly improves your net P&L compared to bettors operating in taxed jurisdictions.
Staking discipline matters as much as model quality. A flat staking plan tied to a fixed percentage of your bankroll per signal keeps drawdowns manageable when the model goes through a losing run. Fractional Kelly sizing, which scales stake size to the estimated edge, can improve returns when your probability estimates are well-calibrated, but it amplifies losses when they are not. Starting with flat stakes and moving to Kelly variants only after validating calibration is the lower-risk path.
Getting started with horse racing data models as a lay bettor
Building or accessing a horse racing model does not have to be complicated. The steps below give you a clear path from zero to placing your first data-informed lay bet.
Steps to build your own baseline model:
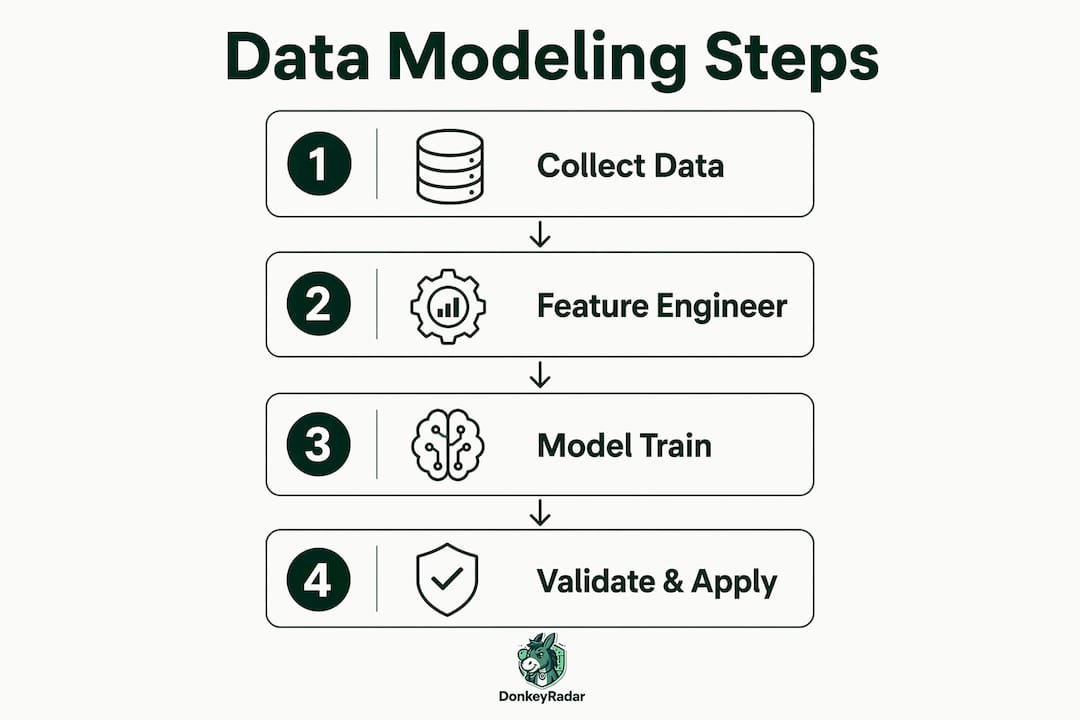
- Gather historical race data covering at minimum two to three seasons, including finishing positions, starting prices, going descriptions, jockey and trainer identifiers, and field sizes.
- Engineer your core features: odds-implied probability, recent form (average finishing position over the last three races), weight carried relative to field average, and binary flags for surface type and course.
- Train a logistic regression model on data up to a fixed cutoff date, then evaluate it on the following season using log-loss and calibration metrics rather than raw accuracy.
- Check whether your model’s probabilities diverge from market-implied probabilities in a consistent direction. If they do not, the model has no edge.
- Apply walk-forward validation across multiple seasons before committing any real stakes.
What to track and monitor on an ongoing basis:
- Horse form: last three to five finishing positions, days since last run, class changes
- Jockey and trainer win rates over the current season and recent meetings
- Track conditions: going descriptions updated on race day, course-specific draw biases
- Market movements: significant late money often signals information not in your model
- Your own strike rate and P&L by signal tier, reviewed weekly
Risk control rules to protect your bankroll:
- Set a maximum lay liability per race, not just a stake amount
- Never exceed 5% of your total bankroll on a single lay bet
- Track every signal, win or loss, to identify whether your edge is holding over time
- Pause and review if you record ten consecutive losses; model drift happens
If you prefer to use verified signals rather than build from scratch, Donkeyradar publishes daily lay tips with full results history. The how to lay a horse on Betfair guide covers the mechanics of placing lay bets on the exchange for bettors new to the format.
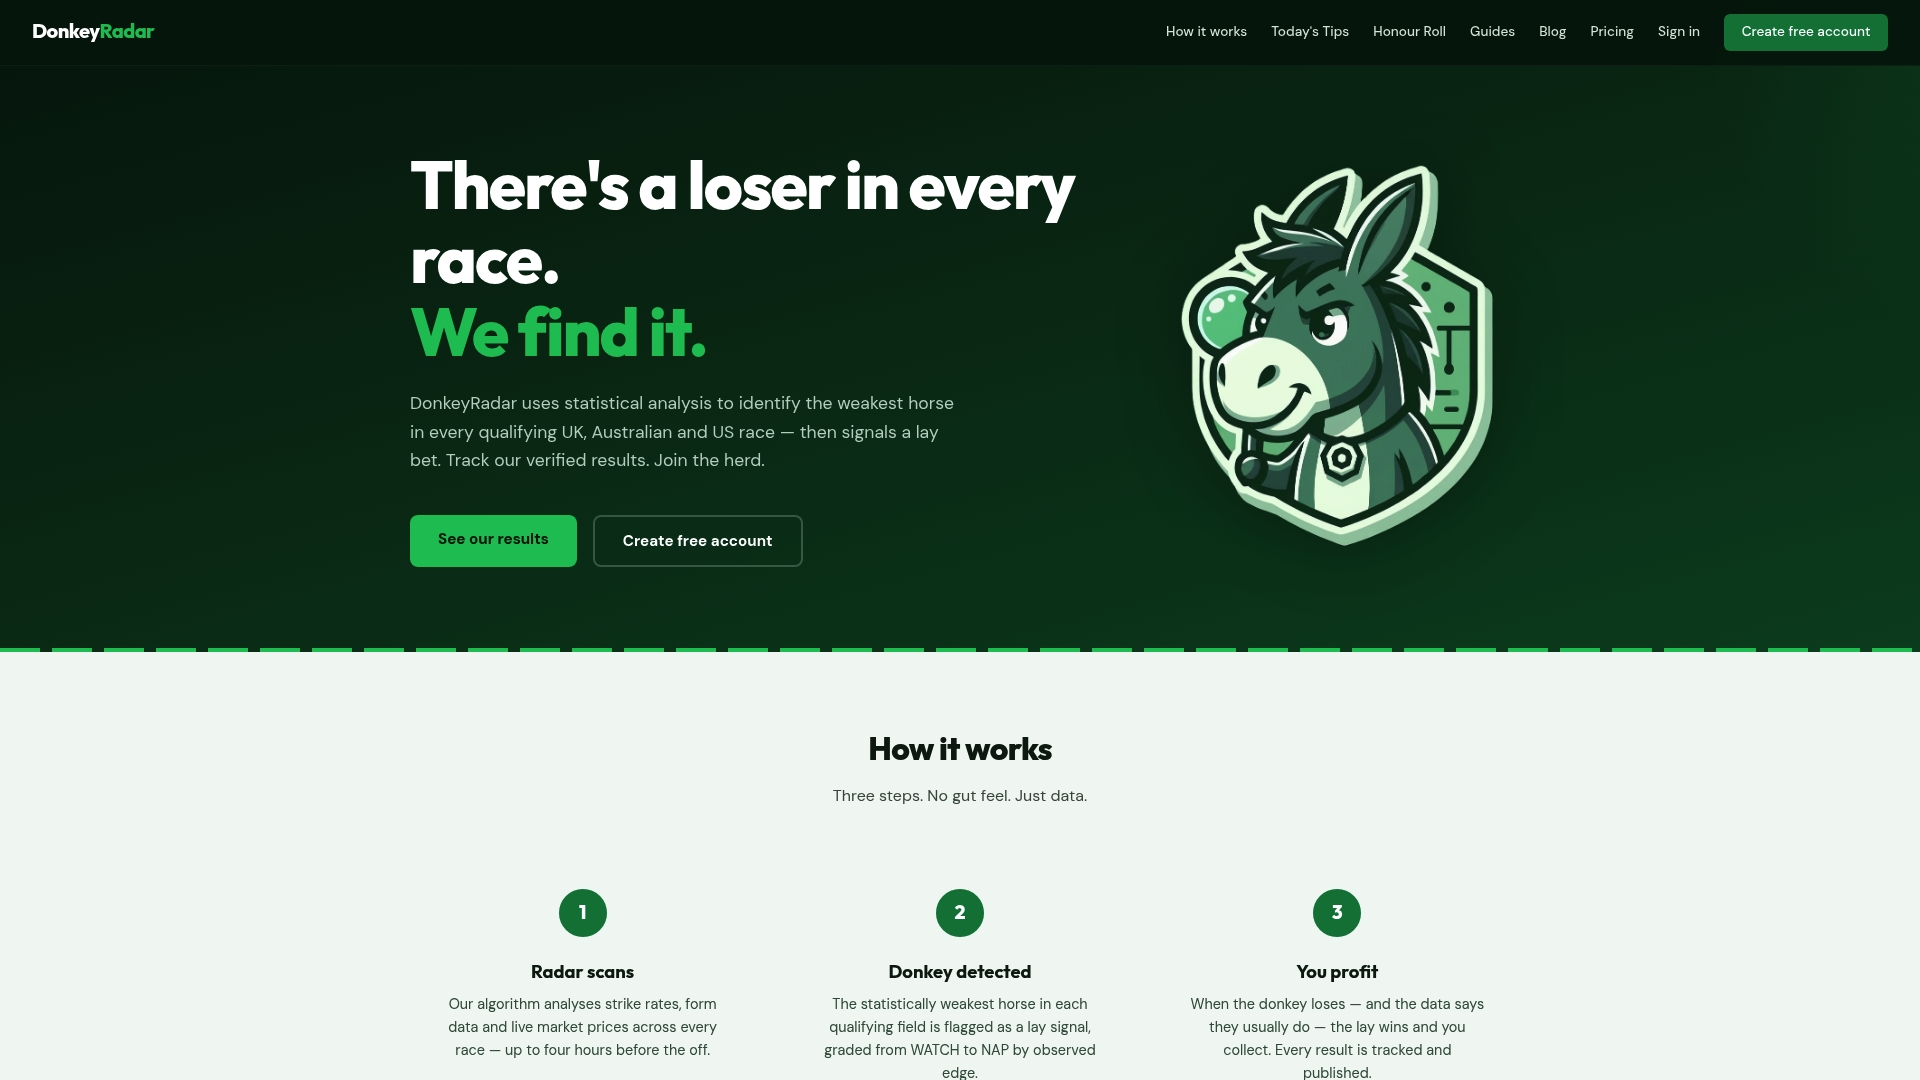
Donkeyradar’s algorithm combines historical strike rates with live Betfair market prices to identify the weakest runner in each race before the off. Signals are graded by staking tier, delivered via real-time email and Telegram alerts, and every result is published and verified. The free tier gives you daily lay signals with no commitment. Start with today’s lay tips and see the verified results record for yourself.
Key takeaways
Horse racing data models generate the most value for lay bettors when they focus on calibrated probability estimates rather than raw prediction accuracy, using that calibration to identify divergences from market odds.
| Point | Details |
|---|---|
| Accuracy ceiling | Prediction accuracy in sports betting models is capped at roughly 70% due to efficient market odds. |
| Calibration over accuracy | Model calibration is more important than accuracy for identifying profitable lay betting edges. |
| Start simple | Logistic regression provides a reliable baseline before advancing to XGBoost or neural networks. |
| Donkeyradar’s strike rate | Donkeyradar combines historical strike rates and live market prices to deliver an over 85% strike rate. |
| UK tax advantage | Betting profits in the UK are tax-free, improving net returns for profitable lay bettors. |