← Blog · 📝 Article · 1 September 2026
Bettors: Model Drawdown and Size Stakes With Monte Carlo

Drawdown is the drop from your bankroll’s peak to its lowest point before it recovers. Maximum drawdown, or MDD, is the worst such drop over your entire betting history.
TL;DR:
- Using percentage-based drawdowns helps compare strategies and set stop-loss rules effectively, especially as your bankroll grows or shrinks.
- Maximum drawdown often contains multiple smaller drawdowns; tracking all of them reveals how frequently significant losses may occur.
- Monte Carlo simulations provide a probabilistic range of potential maximum drawdowns, but results depend heavily on input assumptions like fixed edge and bet independence.
- Proper bankroll sizing should account for your worst historical drawdown, ideally maintaining 50 to 100 units to avoid risking ruin from typical variance.
- Pre-calculating liability and stress-testing stake sizes against expected drawdowns ensures you avoid impulsive decisions and behavioral traps during losses.
Table of Contents
- Betting drawdown explained: units versus percentage
- How to calculate drawdown step by step
- Modelling expected maximum drawdown with Monte Carlo simulation
- What drawdown reveals about risk of ruin and betting psychology
- Staking systems and stop-loss rules that actually reduce drawdown
- Sizing scenarios: what drawdown to expect at different stakes and edges
- Choosing a drawdown calculator: inputs and outputs to check
- DonkeyRadar’s data-driven approach to drawdown control
- An editorial take on sizing for the long haul
- Model your drawdown before you stake a penny more
- Sources
Betting drawdown explained: units versus percentage
A drawdown is simply the distance between a peak in your bankroll and the lowest trough that follows it, before a new peak is set. Maximum drawdown is the largest of those declines across your whole betting record, and it’s the number that matters most when you’re deciding how much to risk per bet. This distinction between drawdown (the peak-to-trough decline in an investment or bankroll)) and maximum drawdown often gets blurred, but the difference is straightforward: you can have dozens of small drawdowns through a season, and only one of them is the maximum.
You can express drawdown two ways, and each tells you something different:
- In units (your standard stake size): a drawdown of 15 units tells you exactly how many losing bets, in stake terms, you absorbed before recovery.
- As a percentage of bankroll: a 15% drawdown tells you how much of your total capital was at risk, regardless of what a unit was worth.
Percentage terms scale with your bankroll, so they’re the better measure for comparing strategies or for setting stop-loss rules. Units are more useful day to day, because they map directly onto your staking plan and don’t shift if you top up or withdraw from the account.
Here’s where bettors trip up: ROI and hit rate tell you nothing about the shape of your losing runs. Drawdown captures that clustering. ROI and strike rate are averages smoothed over the whole sample; drawdown is the worst-case path your bank actually walked, which is precisely why maximum drawdown functions as a core risk indicator that averages alone can’t provide.
How to calculate drawdown step by step
Working out your own drawdown takes nothing more than a spreadsheet and your bet history. Follow these steps against your running bankroll balance after each settled bet:
- List your bankroll after every bet, in sequence, creating what’s known as an equity curve.
- Mark each new peak as the balance is updated. A peak is any point higher than every value before it.
- Calculate the drop from that peak at every subsequent point, until a new peak is reached.
- Record the lowest point in each drop, in both units and percentage terms.
- Repeat across the whole series to find every individual drawdown, then flag the largest as your MDD.
A worked example. Say you start with a 100 unit bank. After 20 bets it peaks at 130 units. Over the next 14 bets, it falls to 91 units before recovering. This is exactly why percentage matters more once your bank has grown: the same unit loss represents a shrinking share of a larger pot.
Pro Tip: *Always calculate drawdown against the rolling peak, not the starting bankroll.
One nuance worth flagging: most betting histories contain several drawdowns, not one. A season might show three or four separate peak-to-trough cycles, each smaller than the true maximum. Tracking every one, rather than just the worst, shows you how often you’re likely to experience meaningful pain, not just how bad the single worst case was.
Modelling expected maximum drawdown with Monte Carlo simulation
Your historical results show you one path your bankroll took. They don’t show you the hundreds of other paths that were equally possible given the same bets, odds and outcomes, just shuffled into a different order. That’s the gap Monte Carlo simulation fills. It takes your actual bet-by-bet results (or your estimated edge and odds) and reshuffles the sequence thousands of times, generating a distribution of plausible equity curves rather than just the one you happened to live through.
Reading the output correctly matters more than running the simulation itself:
- Expected MDD is the average maximum drawdown across all simulated runs, your best single estimate of what to plan for.
- Percentile outcomes show the spread. A 90th percentile MDD of 35% means 1 in 10 simulated futures saw a drawdown that bad or worse.
- Probability of drawdown exceeding X answers the direct question bettors actually care about: what are the odds your bank falls by more than, say, 25% at some point?
This approach is standard practice for serious bettors, and Monte Carlo reshuffling is a recognised method for estimating the probability of a drawdown beyond a given threshold.
The caveats matter as much as the outputs. Small samples produce unreliable simulations. Reshuffling 40 bets gives you 40 data points to draw from, no matter how many thousand times you run it, so the tails of the distribution are guesswork. Simulations also tend to assume a fixed edge and independent bets, both of which flatter reality. Your actual edge drifts over time, and bets on the same card or related markets aren’t always independent. As one caution puts it, Monte Carlo outputs are only as good as the input assumptions, so treat the edge estimate you feed in with real scepticism before trusting the percentile output.
What drawdown reveals about risk of ruin and betting psychology
Risk of ruin is the probability that a losing streak wipes out your bankroll before your edge has a chance to play out, and it’s brutally sensitive to how much you stake. The maths here isn’t subtle: moving from 2% to 10% flat stakes can push ruin probability from under 1% to tens of percent, even with an identical edge behind both approaches. Drawdown is the practical, forward-looking version of this same idea. Instead of asking “could I go bust?”, it asks “how far down will my normal losing runs actually take me?”, and gives you a number to plan against rather than just a binary fear.
Bettors rarely blow up because their edge disappeared. They blow up because they stopped following their own plan the moment the drawdown started to hurt.
The chart doesn’t care how confident you felt after five straight winners. It cares whether your next stake was sized for the losing run that was always statistically possible, not the one you’d convinced yourself couldn’t happen.
Two behavioural traps do most of the damage during a drawdown:
- Recency bias: treating the last few results as more predictive than they are, either doubling down after losses or going cold after a string of wins.
- Chasing: increasing stake size specifically to recover recent losses faster, which is precisely the mechanism that turns a normal drawdown into ruin.
Behavioural research on gambling consistently flags loss chasing and impulsive re-staking as the dominant failure mode during drawdowns, and a written plan that pre-specifies stake reductions in advance is one of the more effective countermeasures, because it removes the decision from a moment when you’re least equipped to make it well.
Set your triggers before the drawdown arrives, not during it. None of that works if you’re improvising the numbers while three losing bets deep and irritated.
Staking systems and stop-loss rules that actually reduce drawdown
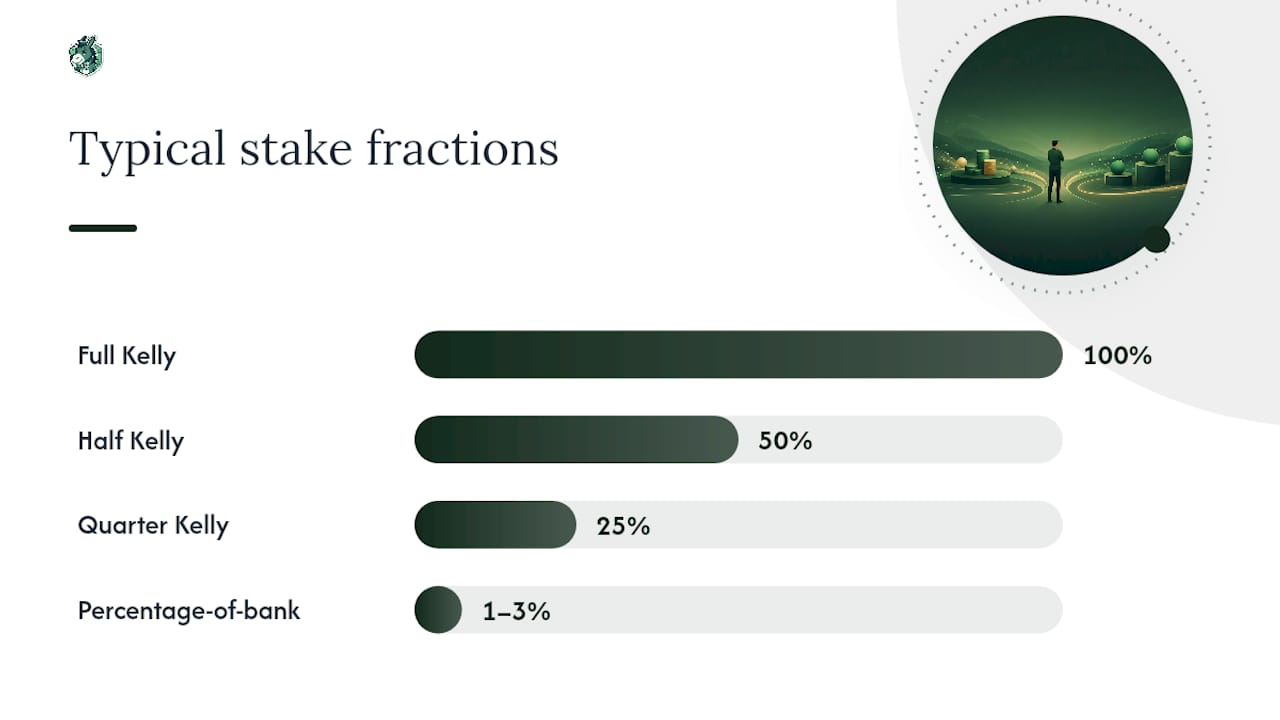
Stake size is the single biggest lever you control, and the Kelly criterion formalises exactly how much of an edge should translate into stake, scaling bet size with your estimated edge over the market price. Full Kelly is aggressive and produces brutal swings, so most serious bettors run fractional Kelly instead, typically half or quarter Kelly, which cuts expected drawdown sharply while giving up comparatively little long-run growth.
Three staking approaches cover most practical needs:
- Flat unit staking: the same stake every bet, simple to track, but slow to compound and doesn’t adjust for a growing or shrinking bank.
- Percentage-of-bank staking: stake a fixed share (commonly 1 to 3%) of the current balance, so losses shrink your stake automatically and drawdowns compress in unit terms as the bank falls.
- Fractional Kelly: stake scales with both edge and bank size, offering the fastest growth for a given drawdown tolerance, but only if your edge estimate is honest.
Tie your stop-loss directly to historical MDD rather than a gut feeling. Diversifying across genuinely uncorrelated strategies smooths the equity curve further, and tracking closing line value alongside your P&L tells you whether a drawdown reflects bad variance or an edge that’s actually eroded, which are two very different problems requiring two very different responses.
Sizing scenarios: what drawdown to expect at different stakes and edges
The table below maps common staking choices against typical edges, using the kind of simulation output WagerBird’s variance research describes as normal for strategies with a real but modest edge.
These ranges are illustrative rather than guaranteed. Drawdowns of 10 to 20% are considered normal even for a strategy with a genuinely positive edge, and larger stakes or more aggressive Kelly fractions push the realistic range well beyond that.
Converting your own historical MDD into a bankroll figure is a short checklist: work out the worst drawdown your backtest actually produced, decide the maximum percentage loss you could stomach without abandoning the plan, then size your bank so that MDD in unit terms sits comfortably under that threshold. A commonly cited baseline is to hold a bankroll of 50 to 100 units to absorb typical variance without going anywhere near ruin.
Choosing a drawdown calculator: inputs and outputs to check
A useful calculator asks for number of bets, expected yield, average odds, unit size and how many simulations to run, typically thousands, to produce a stable distribution. Check the outputs it actually gives you: expected profit alone is close to worthless without expected MDD and, ideally, the probability of drawdown exceeding a level you’d find painful.
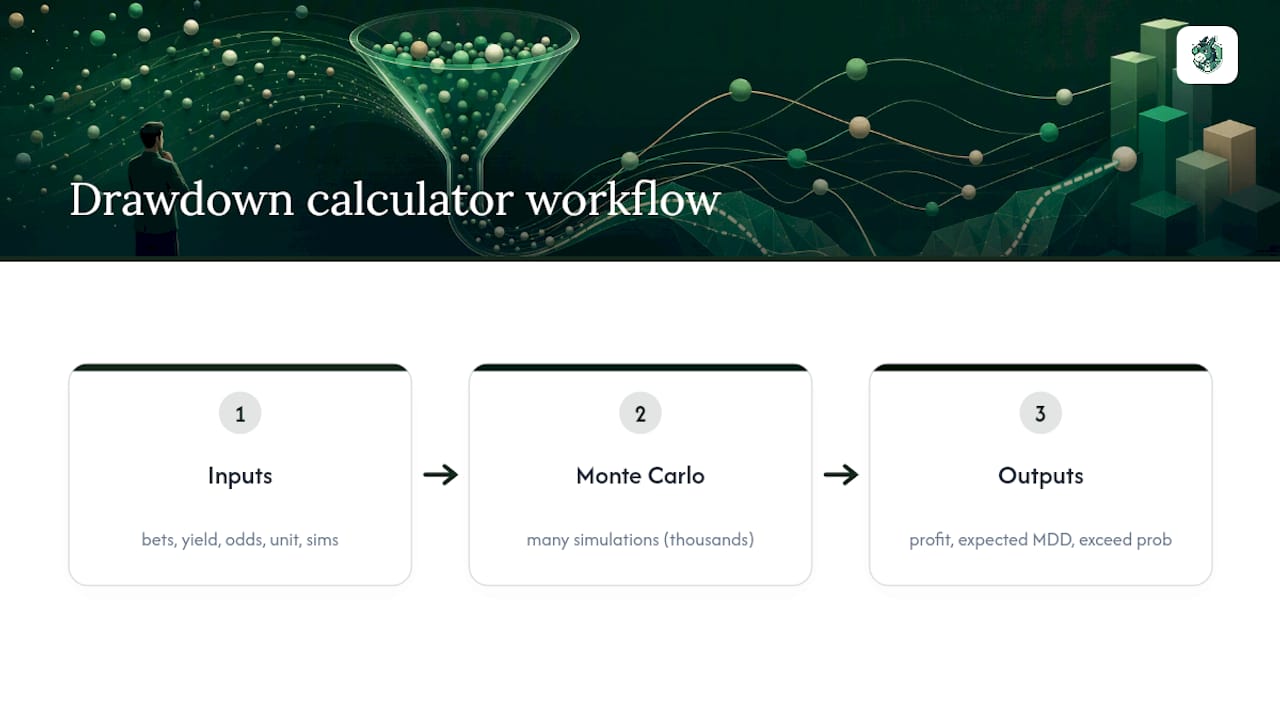
Before trusting any tool, interrogate its assumptions. Does it let you input your own historical edge rather than an optimistic default? Does it account for odds movement? A calculator that only reshuffles a flat win rate at fixed odds will understate real-world drawdown. Cross-check outputs against your own tracked equity curve and closing line value, because a tool’s projected drawdown means little if your actual edge doesn’t match what you fed it.
DonkeyRadar’s data-driven approach to drawdown control
Donkeyradar builds lay betting signals on statistical analysis of historical strike rates and live Betfair prices, with every signal published before the race and results tracked openly, including the losing ones. That transparency matters for drawdown specifically: you can’t size stakes sensibly against a strike rate you can’t verify.
The published record lets subscribers backtest their own MDD expectations rather than guess. Combine that history with the lay betting bankroll guide and the Betfair lay betting strategy breakdown to translate signal-level performance into a personal unit-sizing and stop-loss plan, rather than staking on faith alone.
An editorial take on sizing for the long haul
Most bettors size stakes for the winning streak they’re hoping for, not the losing one they’ll actually get. That’s backwards. Model your expected maximum drawdown honestly, set your unit size and stop-loss rule before you need them, then track every result alongside closing line value so you know whether a slump reflects variance or a fading edge. Test conservatively at first. A strategy worth trusting will still be worth trusting at half the stake.
— Donkey
Model your drawdown before you stake a penny more
Reading about drawdown is one thing; seeing your own liability numbers is another. Donkeyradar’s lay betting calculator lets you work out liability, break-even and profit for any lay bet before you place it, so you can stress-test unit sizes against the drawdown ranges covered above rather than guessing.

If lay betting mechanics are still new to you, the lay betting explained guide covers how liability works from first principles. Once you’re comfortable with the maths, Donkeyradar’s published signals and verified results give you a real historical record to size a bankroll against, rather than an unverifiable claim. Start a free trial, run your intended unit size through the calculator against Donkeyradar’s tracked strike rate, and confirm your stop-loss threshold sits where this article recommends before your next stake.
Sources
- Variance and drawdown — WagerBird Learn
- Bankroll management for sports bettors — Trackbet
- Drawdown Monte Carlo simulation calculator for sports betting — WinnerOdds
- The importance of drawdown in sports betting — Betaminic