← Blog · 📝 Article · 9 September 2026
Liability First All Weather Lay Strategy Using DonkeyRadar Signals

Selective laying of overvalued or weak favourites on all-weather cards produces a repeatable edge, but only when you size every bet by liability, not stake. All-weather races reward this approach because form is more comparable and weak favourites get overbet by casual money. The rest of this piece covers exactly how to filter targets, size lays, and execute them without blowing your bankroll on a bad run.
TL;DR:
- Focusing on narrow odds bands between 1.60 and 3.00 improves the profitability of laying weak favourites on all-weather racing, especially in lower-class handicaps.
- Proper target selection involves checking field size (preferably eight or more runners), avoiding horses with strong course form, and filtering out multiple red flags such as recent drops in class or headgear changes.
- Sizing lays by liability rather than stake, fixed at around 1% of bankroll per bet, and adjusting using Kelly or quarter-Kelly methods helps manage risk during long losing streaks.
- Enter and exit trades using lay-to-back strategies with pre-set profit targets to lock in gains during gradual odds movements, which are more predictable on all-weather surfaces.
- Consistent discipline, thorough testing, detailed logging, and a strict liability cap are essential to sustain the edge and avoid ruin during inevitable variance.
Table of Contents
- Why all-weather racing produces repeatable lay chances
- How do you pick which favourite to lay on all-weather cards?
- Staking and liability: sizing lays using liability, Kelly and fixed caps
- Execution and market management: lay-to-back, trading and timing
- Risk management and common mistakes every layer must avoid
- Day-of workflow: a compact playbook for running the AW lay strategy
- How DonkeyRadar applies these rules: signal use-cases and verified outcomes
- What role does the seasonal calendar play in AW lay timing?
- How do track conditions on all-weather surfaces change the strategy?
- How does lay odds movement differ between all-weather and turf racing?
- Can data analytics improve all-weather lay selections?
- What do historical results tell us about all-weather lay strategies?
- Author perspective: lessons learned and practical cautions
- How to use DonkeyRadar to run this all-weather lay strategy
- Sources
Why all-weather racing produces repeatable lay chances
All-weather racing gives layers something turf rarely offers: consistency. The surface at Newcastle, Southwell, or Chelmsford City doesn’t change with the weather, so a horse’s recent form on the same going carries more signal than it would after a downpour turns a turf track from good to soft overnight. That stability matters because lay betting depends on spotting when the market has priced a horse wrong, and it’s far easier to judge “wrong” when the underlying conditions stay fixed race after race, week after week.
The card structure helps too. All-weather (AW) fixtures run heavily on handicaps, and lower-grade handicaps in particular throw up a specific pattern: a “form” favourite gets backed down to a short price purely because it ran well last time out, while the market underweights a genuine step up in class, a wider draw, or a jockey booking hinting at stable confidence elsewhere. Matchbook’s own trading guidance points squarely at weak favourites in handicaps as the most exploitable target, and AW cards produce them daily rather than occasionally.
There’s also a public-money effect worth understanding before you place a single lay. Weekend AW cards, and particularly the twilight and evening fixtures that dominate winter scheduling, attract casual backers chasing a “sure thing” from a tipster line or a shortened price they’ve seen trending. That demand shortens the favourite’s odds beyond what the form justifies, and it does so predictably enough that you can build a routine around it rather than chasing one-off opportunities.
None of this means every favourite is a lay target. Research from RaceAdvisor found that laying every All Weather favourite in a sample of 6,105 selections returned a profit of +134.16 units, a 69% win rate for the favourites laid, but an Actual/Expected (A/E) ratio of 0.97. An A/E below 1.00 means the market was, on balance, pricing those favourites about right once probability is accounted for. The headline profit looks tempting, but it’s fragile without further filtering, which is exactly why selection criteria matter more than blanket laying.
What AW gives you that blanket approaches waste is the chance to niche down. Rather than laying every favourite on every card, you can focus on a narrow slice, for example certain lower-class handicaps at a specific trip, where the inefficiency tends to repeat with enough regularity to build confidence. That narrower focus is where the edge tends to hold up:
- Surface consistency removes weather as a confounding variable.
- Handicap-heavy AW cards concentrate the weak-favourite pattern in certain race types.
- Casual weekend money inflates short-priced favourites beyond what recent form supports.
- Niching to specific classes or courses, rather than laying blindly, helps turn a fragile average edge into something more repeatable.
Understanding why the opportunity exists is only half the job. The other half is knowing which favourites to lay and which to leave alone, which is where a proper checklist is useful.
How do you pick which favourite to lay on all-weather cards?
Picking the right target is where most new layers either make their money or give it back in commission and bad luck. A workable checklist filters at these levels: odds band, the race itself, and the individual horse.
Odds band. Favourites priced approximately between 1.60 and 3.00 offer the best balance of frequency and value. Prices shorter than 1.60 rarely lose often enough to justify the liability, and the margin for error is narrow. Prices longer than 3.00 usually are not the true market leader, so the “weak favourite” mispricing effect is less pronounced.
Race-level filters. Field size matters. Smaller fields concentrate the win probability heavily on a few horses, limiting scope for a mispriced favourite to be beaten by the rest. Fields with eight or more runners give a healthier spread of live threats. Class matters: lower and mid-tier handicaps (around Class 4 to 6) show this pattern most reliably, drawing inconsistent form lines and casual attention without the tighter pricing of higher levels.
Horse-level red flags. Some indicators suggest avoiding a lay:
- Strong course-and-distance form, especially repeated wins on the AW surface.
- Jockey or trainer with a recent hot streak.
- First-time headgear applied by a yard known for improving horses this way.
- Significant drop in class with a shortened price, as this can be a genuine form angle.
- Specific surface conditions favouring the favourite’s running style.
If two or more red flags appear, skip the race. If none apply and the horse fits the odds band and field size criteria, consider a lay.
Two examples: a 2.20 favourite in an eight-runner Class 5 handicap at Kempton stepping up in class with no headgear change and a quiet jockey is a lay worth considering. A 1.75 favourite at Southwell with strong course-and-distance form, first-time cheekpieces from a yard known for sharp improvers, and a red-hot apprentice booked is better avoided.
Pro Tip: Keep a simple spreadsheet column for “reason skipped” every time the checklist fails. After a month, you’ll usually find one red flag accounts for most of your skips, and that tells you exactly where your model needs sharpening.
Staking and liability: sizing lays using liability, Kelly and fixed caps
Get the staking wrong and even a well-chosen lay can sink your bankroll, because a lay bet’s risk isn’t the stake you place, it’s the liability you’re exposed to if the horse wins. Betfair defines liability as the backer’s stake multiplied by (lay odds minus 1), and your account must hold that full amount from the moment you place the lay.
Here’s what that means in practice. If you lay a horse at odds of 3.00 for a £10 stake, your liability is £10 × (3.00 − 1) = £20. Lay the same £10 at odds of 5.00, and liability jumps to £40. The stake barely changes your risk profile; the odds do almost all the work, which is exactly why sizing by stake alone is a mistake serious layers avoid.
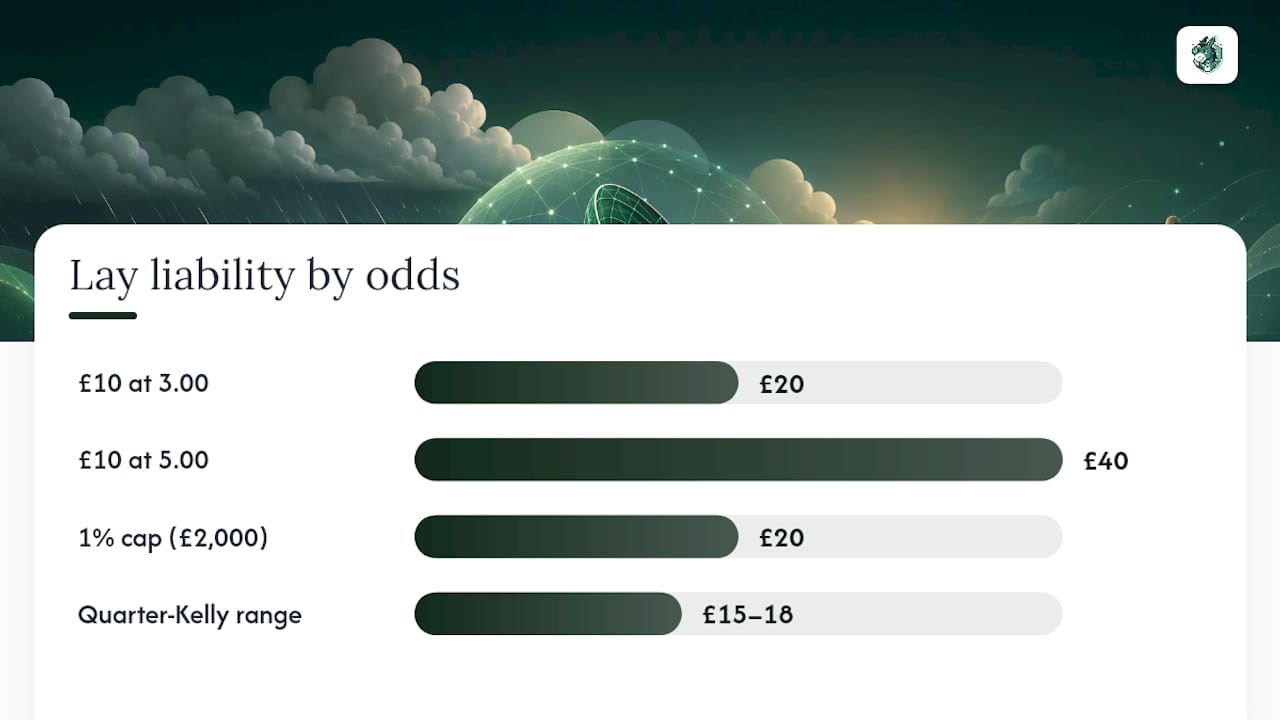
Fixed-liability staking flips the calculation around. Instead of deciding a stake and discovering your liability afterwards, you fix the liability first, say, 1% of your bankroll per lay, and back-calculate the stake the odds allow. With a £2,000 bankroll and a 1% liability cap (£20), a lay at 3.00 odds gives you a stake of £20 ÷ (3.00 − 1) = £10. The same £20 cap at 5.00 odds only allows a £5 stake. This is the single biggest discipline shift new layers need to make, and it’s covered in more depth in Donkeyradar’s guide to fixed-liability staking.
Quarter-Kelly on liability takes this further for bettors comfortable with a bit more maths. The Kelly Criterion sizes a bet as a proportion of your edge divided by the odds, but full Kelly is far too aggressive for lay betting’s binary win/lose liability structure. Quarter-Kelly (dividing the standard Kelly fraction by four) tames the swings while still scaling stakes to reflect genuine edge. Say your model gives a favourite a 38% chance of winning against a market-implied 42% (from odds of about 2.38), your edge is roughly 4 percentage points. Applying quarter-Kelly against that edge, at a £2,000 bankroll, might suggest a liability of around £15 to £18 rather than a flat 1% every time, scaling up when your edge is wider and down when it’s marginal.
A consistent liability of just 1% of a £2,000 bankroll per lay, roughly £20, keeps a run of ten straight losers to a 10% drawdown, survivable, and recoverable with discipline intact.
Commission changes the maths too. Most exchanges take a percentage of net winnings, not turnover, but that still erodes thin edges. KiqIQ’s framework recommends targeting a minimum post-commission edge of around 3% before placing a lay at all, and lower-commission exchanges, Smarkets cites a 2% rate as an industry-low example, change that threshold in your favour compared with pricier alternatives.
Before committing real money to any of this:
- Run the full staking plan on paper for at least two to three weeks of AW cards before switching to live stakes.
- Track liability, not just profit and loss, so you can see your actual bankroll exposure over time.
- Stress-test against a losing streak of ten or more before you trust the numbers with serious capital.
- Revisit your quarter-Kelly inputs monthly, since a stale edge estimate is worse than no edge estimate at all.
Execution and market management: lay-to-back, trading and timing
Picking the right horse and sizing the lay correctly only gets you halfway. How you enter and exit the position on the exchange decides whether that edge actually reaches your account balance.
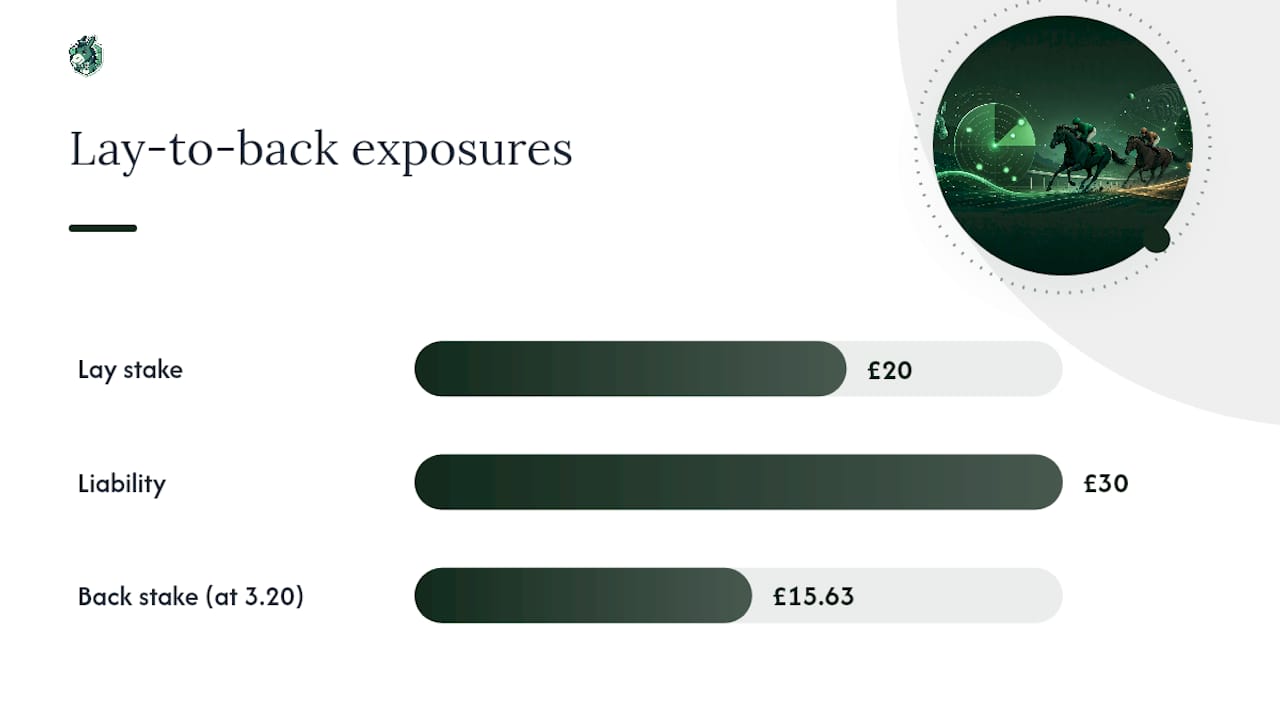
Lay-to-back trading is the core technique serious layers use to lock in profit without waiting for the race to finish. Here’s a worked scenario: you lay a favourite at 2.50 for a £20 stake, giving a liability of £30. If the market moves against that horse, perhaps a rival draws market support, or the price simply drifts as the race approaches, and the odds move out to 3.20, you can back the same horse at 3.20 for a stake that locks in profit regardless of the result. Backing £15.63 at 3.20 roughly matches your original liability, and the difference between what you laid at and what you backed at becomes locked-in profit whether the horse wins or loses. This is the mechanic covered in detail in Donkeyradar’s guide to lay-to-back strategy and the step-by-step process for laying a horse on Betfair.
Matching at Betfair Starting Price (BSP) suits a specific situation: you’ve done your filtering, you’re confident in the selection, but you don’t want to babysit the market in the minutes before the off. BSP matching works well in liquid races with plenty of runners and steady market depth. It’s riskier in thin fields or lower-tier meetings where the closing price can swing sharply on a small amount of late money, exactly the kind of race where your liability calculation might no longer reflect reality by the time the bet matches.
A practical execution routine looks like this:
- Confirm the market has sufficient depth (available liquidity at or near your target odds) before committing, thin books mean poor fills and unpredictable slippage.
- Place the lay at your calculated liability, never adjusting the stake upward “because it feels safe” once the bet is live.
- Set a mental or automated exit price for a lay-to-back trade, typically when the odds have drifted 20 to 30% beyond your entry price.
- Decide in advance whether you’re holding to the finish or trading out, and don’t change that decision mid-race based on emotion.
- Log the entry odds, exit odds (if traded), and final result immediately after the race, while the details are fresh.
Automation helps enormously here without needing anything exotic. Price alerts on your phone, pre-set ladder orders on the exchange interface, and a simple watchlist of today’s qualifying races all reduce the chance you miss a good entry or panic-exit a trade that was actually fine. None of this requires third-party trading software, just discipline applied consistently to the same short list of races each day.
Risk management and common mistakes every layer must avoid
Bankroll survival matters more than any single winning lay, because one oversized liability on a bad day can undo weeks of careful staking discipline.
Set hard limits before you place a single bet, not after a loss makes you wish you had. A sensible ceiling is a maximum liability of 1% to 2% of bankroll per lay, with a daily session cap of no more than 5% to 6% of bankroll exposed across all open positions combined.
The most common mistake among new layers is chasing losses. A favourite you laid correctly wins anyway, you feel the loss, and the temptation is to increase the next liability to “get it back” faster. This is exactly backwards.
Ignoring liquidity is the second big error. A tempting price on a thin AW market can look great until you try to place the lay and discover there’s only enough money at that price to fill a fraction of your intended stake. Always check the depth of the market before committing, and treat a shallow book as a reason to reduce size or skip the race entirely.
Underestimating commission is the third. Build commission into your edge calculation from the start, not as an afterthought once the money’s already gone.
A few psychological rules keep the whole system honest:
- Never increase liability size to chase a loss, full stop.
- Take a break after any losing session that hits your daily cap, don’t “just watch one more race.”
- Review your log weekly rather than emotionally re-litigating each individual result.
- After a significant loss, drop to half your normal liability size for the next three sessions before returning to full size.
Pro Tip: Write your hard limits on a sticky note on your monitor before your first session of the week. It sounds basic, but the physical reminder outperforms good intentions almost every time variance tests your discipline.
Day-of workflow: a compact playbook for running the AW lay strategy
A repeatable strategy needs a repeatable routine, otherwise every session becomes a fresh decision under time pressure, and time pressure is when discipline slips.
Before the session, confirm your current bankroll figure and recalculate your liability cap from that number, not from last week’s balance. Select which AW meetings you’re covering that day, and load your filters, odds band, field size, class, and red-flag checklist, so you’re scanning races with a fixed set of rules rather than gut feel.
During the session, work through each qualifying race methodically:
- Screen the race against your odds band and field-size filters first, discarding anything that fails immediately.
- Check the horse-level red flags for any favourite that passes the first filter.
- Confirm market liquidity is sufficient to fill your intended lay near the displayed price.
- Place the lay sized by liability, not stake, using your pre-calculated cap.
- Set your exit plan, hold to finish or trade out at a defined drift threshold, before the race goes off, not during it.
After the session, log every lay you placed, whether you took it to the finish or traded out, and note the result alongside your odds band, class, and any red flags you considered but overrode. A simple logsheet with columns for date, course, horse, entry odds, liability, exit method, and result gives you enough data within a month to see whether your filters are actually working or need tightening.
This isn’t a glamorous process, and it isn’t supposed to be. The repeatability is the point.
How DonkeyRadar applies these rules: signal use-cases and verified outcomes
The signal service is built around this liability-first, selective-laying approach, applying statistical analysis to historical strike rates and live market prices to flag horses likely to underperform their market position before the race starts, across UK, Australian, and US fixtures. Every signal is published ahead of the race, and results are tracked and verified publicly afterwards, which matters in an industry where plenty of tipping services only show you the wins.
Here’s how the outputs slot into the templates already covered in this article:
- Use staking tier grading alongside your own fixed-liability cap, treating higher-confidence signals as candidates for a slightly larger (but still capped) liability, and lower-confidence signals for the minimum.
- Feed a signal into the lay-to-back workflow directly: enter at the flagged price, monitor for drift, and trade out using the same 20 to 30% threshold discussed earlier in the execution section.
- Cross-check any signal against your own red-flag checklist before committing, the algorithm handles the statistical filtering, but course-specific quirks and late equipment changes are worth a final human glance.
- Real-time alerts can remove the need to manually scan every AW card, freeing up time to focus on staking discipline rather than race-finding.
The sensible way to test any of this, whether you use Donkeyradar’s signals or build your own filters from this article, is to run it on paper first. Track seven days of signals against the public verified results history without staking a penny, compare that against your own selection checklist, and only scale up gradually once the pattern holds over a real sample rather than a lucky week.
What role does the seasonal calendar play in AW lay timing?
All-weather racing runs a genuinely year-round calendar, but its character shifts with the seasons in ways that matter for timing your lay strategy. Winter, roughly November through February, is peak AW season in the UK, when turf racing thins out and AW becomes the only game in town on many days. That concentration of fixtures means more casual weekend money chasing a smaller pool of meetings, which tends to sharpen the exact mispricing pattern this strategy targets.
Summer AW cards, competing against a packed turf calendar including major festivals, attract less casual attention and often thinner fields, since serious yards save their better horses for turf targets during the warmer months. That doesn’t mean summer AW is worthless for laying, but the weak-favourite pattern shows up less reliably, and field sizes can dip below the eight-runner threshold worth targeting.
The practical takeaway is to weight your session frequency toward the winter months when AW dominates the racing calendar, and to tighten your filters further during summer, when a smaller, higher-quality field of horses actually turns up. Treat the calendar itself as one more filter rather than background noise.
How do track conditions on all-weather surfaces change the strategy?
All-weather surfaces don’t experience “good to soft” the way turf does, but they do vary between what’s typically described as fast, standard, and slow, largely driven by maintenance, moisture content, and temperature rather than rainfall alone.
A fast surface tends to favour speed and front-running types, and it can shorten the price of a proven pace horse beyond what’s justified if the rest of the field includes closers who simply need the extra half a length a slower surface would give them. A standard surface is where most of your historical form comparisons hold up best, since it’s the baseline condition most horses have raced on before. A slow or “cushioned” surface, common after maintenance work or in colder temperatures, tends to level the field more, and it’s here that a favourite with no proven form in those specific conditions becomes a stronger lay candidate.
The practical adjustment is straightforward: check the course’s published going or surface report before applying your checklist, and treat any surface deviation from standard as an extra red flag to weigh against a favourite with no recent form in that specific condition. It’s a smaller adjustment than the odds band or field-size filters, but it sharpens selections meaningfully on the days conditions have shifted.
How does lay odds movement differ between all-weather and turf racing?
All-weather odds tend to move more gradually in the run-up to a race than turf odds do, largely because AW fields are more often set weeks in advance without the late going changes that shake up turf markets. A turf favourite can see its price swing sharply in the final hour if rain arrives unexpectedly or the ground firms up faster than forecast, all-weather rarely produces that kind of late shock, since the surface simply doesn’t change on raceday.
That steadier movement is actually an advantage for the lay-to-back trading technique. A gradual drift is easier to catch and trade out of than a sudden, sharp one, giving you a more predictable window to lock in profit rather than racing against a market that’s already moved past your exit target. Turf markets can offer bigger single swings when conditions shift, but they’re also harder to time consistently.
The trade-off is liquidity. Major turf meetings, particularly festival cards, often carry deeper markets than a midweek AW fixture, meaning your fill quality on a large lay can be better on turf even though the overall mispricing opportunity, per the RaceAdvisor sample discussed earlier, tends to favour AW’s more repeatable handicap patterns.
Can data analytics improve all-weather lay selections?
Applying statistical models to AW lay betting works best when the model is trained specifically on all-weather form rather than a generic dataset blending turf and AW results together, since the surface consistency that makes AW attractive for laying also means a model needs AW-specific inputs to actually capture it.
Useful inputs for a tailored AW model include course-and-surface-specific strike rates (not just overall course form), field-size-adjusted win probabilities, and jockey/trainer combination data filtered to AW fixtures only. Historical AW-favourite performance data showing an A/E ratio below 1.00 across a large sample is itself a useful benchmark: a model or checklist that can reliably identify the subset of favourites pushing that ratio down, rather than laying blind across the whole sample, is doing genuinely useful statistical work.
The honest caveat is that predictive modelling alone rarely beats disciplined execution. Market-management technique, when and how you trade a lay position, tends to matter as much as the underlying selection model, which is part of why this article spends as much time on staking and execution as it does on picking targets.
What do historical results tell us about all-weather lay strategies?
Read carefully, that’s a genuinely useful data point, not a green light for blanket laying. The sub-1.00 A/E figure means the apparent profit sits close to what the market’s own pricing implied, and a modest change in sample composition or filtering could easily flip that result the other way.
The lesson from that sample isn’t “lay every AW favourite.” It’s that AW as a category shows enough of a pattern to be worth investigating seriously, but that pattern only becomes reliably profitable once you layer in the selection criteria, odds bands, field-size thresholds, and red flags, covered earlier in this article. Bettors who treat the raw historical profit figure as proof of an edge, without applying further filters, are the ones most likely to see that edge disappear the moment their sample size grows.
Author perspective: lessons learned and practical cautions
The hardest part of this strategy isn’t finding the right horse to lay. It’s sticking to your own liability cap on the day a genuinely tempting favourite ticks every red flag and you still want to take the bet anyway. Discipline erodes fastest exactly when a plan is working, because a run of wins convinces you the rules were conservative and you could have sized up. Resist that instinct. The RaceAdvisor sample’s 0.97 A/E is a useful reminder that the raw numbers flatter blanket approaches less than they first appear to.
Variance in lay betting is unforgiving in a specific way: because liability, not stake, defines your downside, a short losing run at higher odds can look far worse on your bankroll chart than the same number of losses at shorter odds would. That asymmetry catches people out who’ve only ever thought about betting in terms of stake size.
Testing matters more than confidence. Two or three weeks of paper trading before committing real liability isn’t caution for its own sake, it’s how you find out whether your checklist actually filters out the fragile edge the way you think it does. Keep a plain log: date, course, odds, liability, red flags considered, result. After a month, the log tells you more about whether your approach works than any single big win or loss ever will.
— Donkey
How to use DonkeyRadar to run this all-weather lay strategy
There are services providing published lay signals, staking tier grading, and a public verified results history, so you can see how algorithmic calls have performed before you stake a penny of your own money.
The service covers UK, Australian, and US fixtures, and the free tier delivers daily signals so you can test the approach against your own checklist without committing to anything. If you’re still getting comfortable with the mechanics covered above, start with the lay betting explained guide, then use the lay betting calculator to convert your bankroll and target liability into an actual stake before you place anything live. Real-time alerts via email or Telegram, full results history, and API access for trading software sit behind the paid tier, worth considering once you’ve paper-traded the free signals for a week and are comfortable with how they’ve performed. Profits from UK betting are also tax-free, which sharpens the appeal once your staking discipline is solid enough to compound consistently. Start with the free signals today and see how they measure against the checklist you’ve just learned to apply.
Sources
For the mechanics of lay betting and liability, Betfair’s own support pages remain the clearest primary reference, since they define the exact formula exchanges use.
For safer-gambling guidance and setting personal limits, GambleAware is the standard UK resource, and it’s worth bookmarking before you scale up any staking plan.
Where downloadable strategy templates or shared data are published under an open licence, the Creative Commons Attribution 4.0 licence is the relevant framework to check before reuse.
- Laying the Favourite in Horse Racing: Expert Guide for 2025
- Exchange: What does the term ‘lay’ mean and what is a lay bet? — Betfair Support
- Lay betting strategy: 5-step EV framework for picking lay value | KiqIQ
- Horse racing: when to lay the favourite — Matchbook Insights